Question: Given the Baltic Assessments for 2 quarters ahead FFAs for Average 5TCs of Capesize and 4TC of Panamax (5TC_C+2Q and 4TC_P+2Q) from 1 Jan 2018 to 7 June 2022 in Excel worksheet “BFA CSZ & PMX”
21 Jun 2023,11:21 PM
Objectives:
The aim of this coursework is to familiarize yourselves with the concepts of shipping derivatives and risk managements. In particular, students will learn how to: execute a freight hedging strategy in dry and wet bulk shipping operations, use freight options in risk management, manage bunker risk in shipping operations, analyse credit risk assess default probabilities, and finally assess and monitor risk exposure of freight derivatives using VaR.
Question 1: Container Market Hedging
The following table presents the forward curve for FBX01 (China/East Asia to North America West Coast) on 01/09/2021. Rates are quoted in US$/FEU.
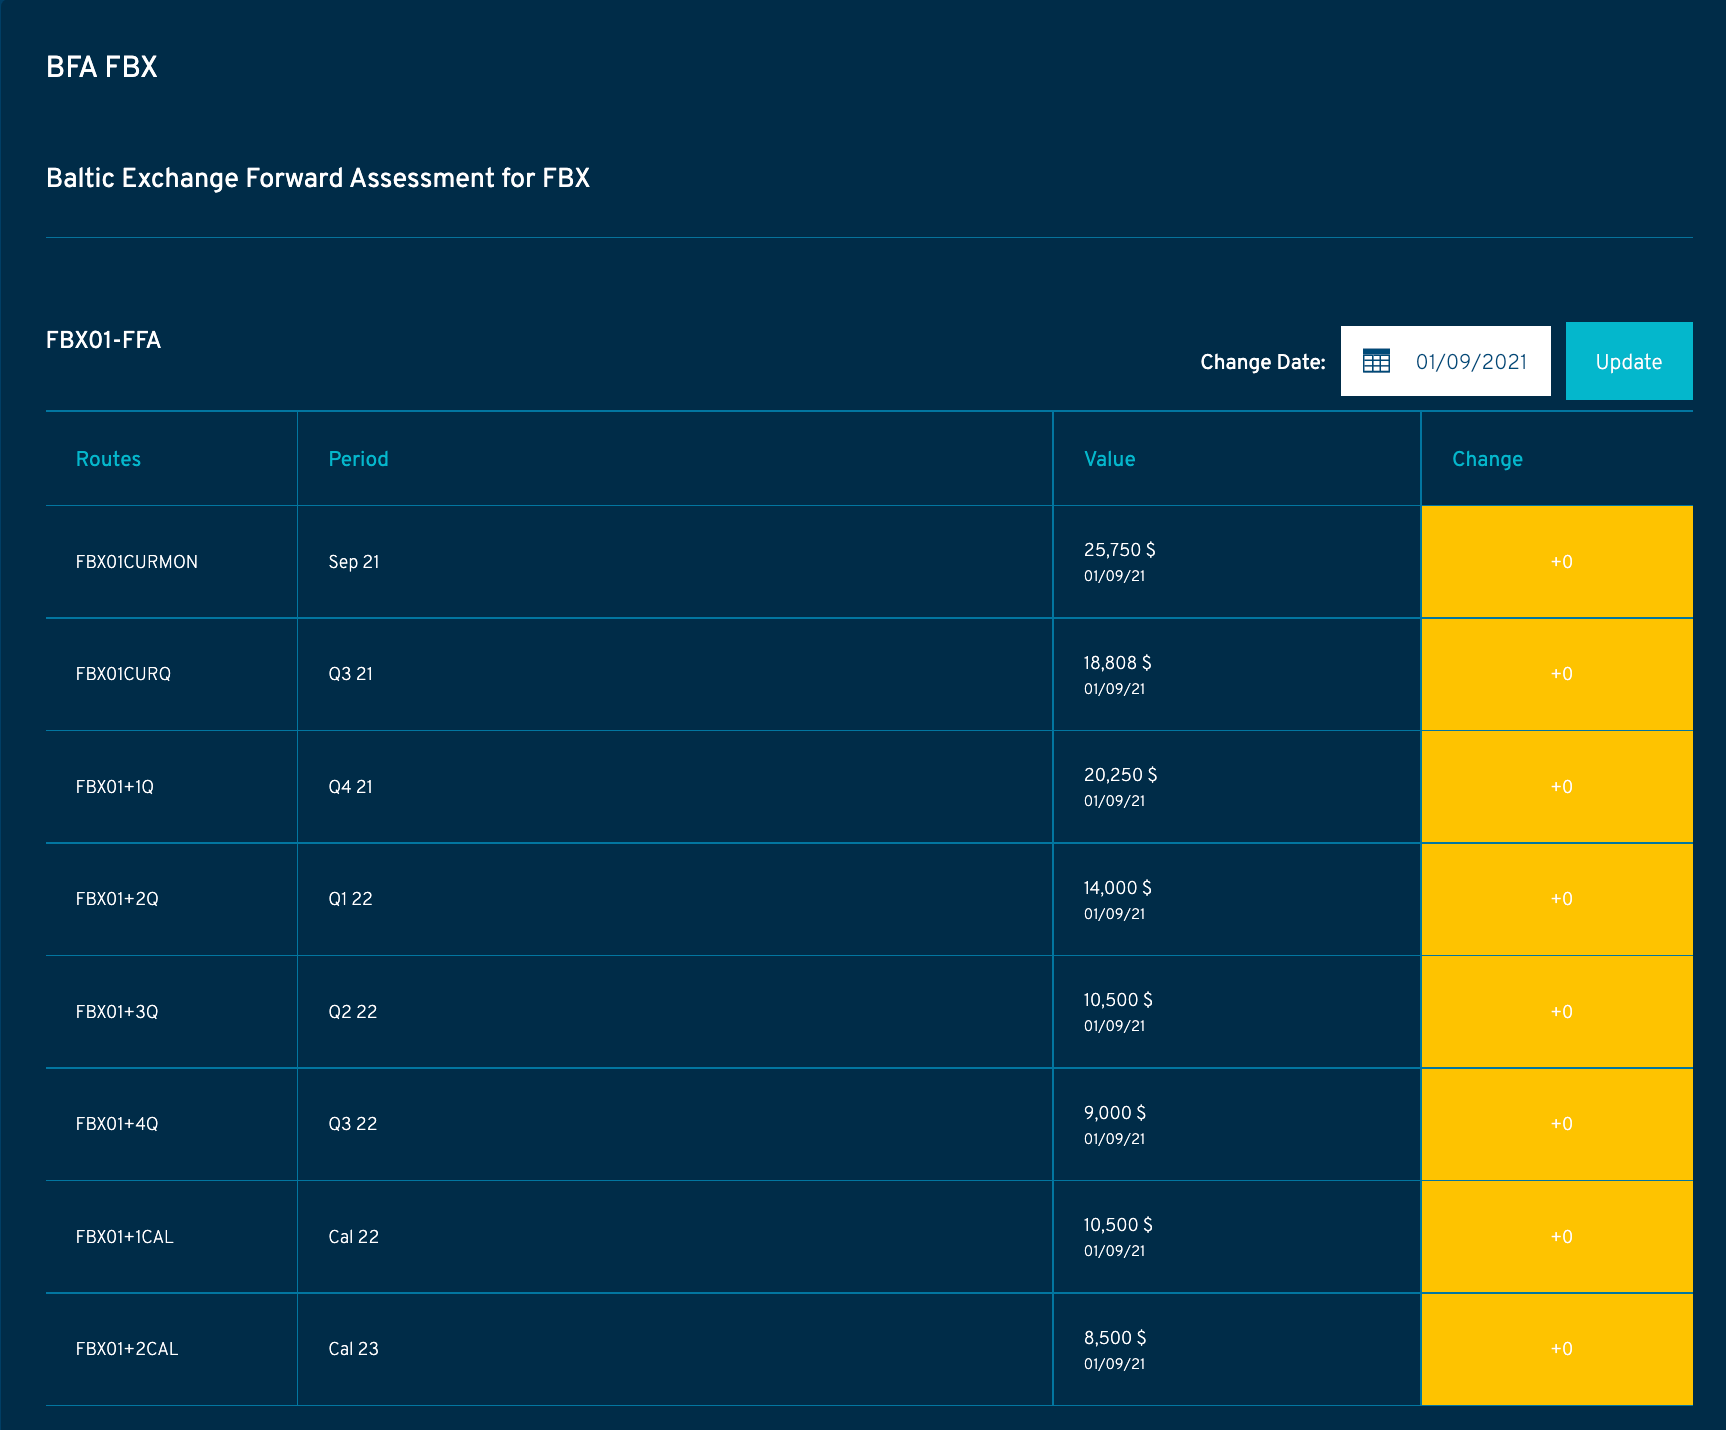
A: Explain how a Shipper can use the Forward rates above to hedge the risk arising from fluctuations in Container Freight Rates.
B: Walmart anticipates that it will need to ship 100 FEU boxes from China to USWC for each month of the 4th quarter of 2021 (Q4-21) and the first quarter of 2022 (Q1-22). Walmart is mindful of the high volatility in container freight rates and is looking into the FBX FFA market to hedge its exposure. Advise Walmart on what would be the best strategy to hedge its freight rate risk.
C: Using the data from the attached spreadsheet, (tab: FBX-01) calculate the effectiveness of the strategy for Q4-21 and Q1-22
Question 2: Financial Markets and Derivatives Terminology
A cargo forwarder is new to the area of risk management. He is therefore reaching out to you to ask for your guidance with respect to the following terms:
A: Basis and Basis Risk
B: Backwardation and Contango
C: What is a Clearing House and how Marking to Marking Works?
In each case, provide the definition and give an example of how it would apply to the Container FFA market.
Question 3: Freight Options and Bunker Swaps
A) Consider the following option quotes on 23/02/18 for BCI 5TC Options.:
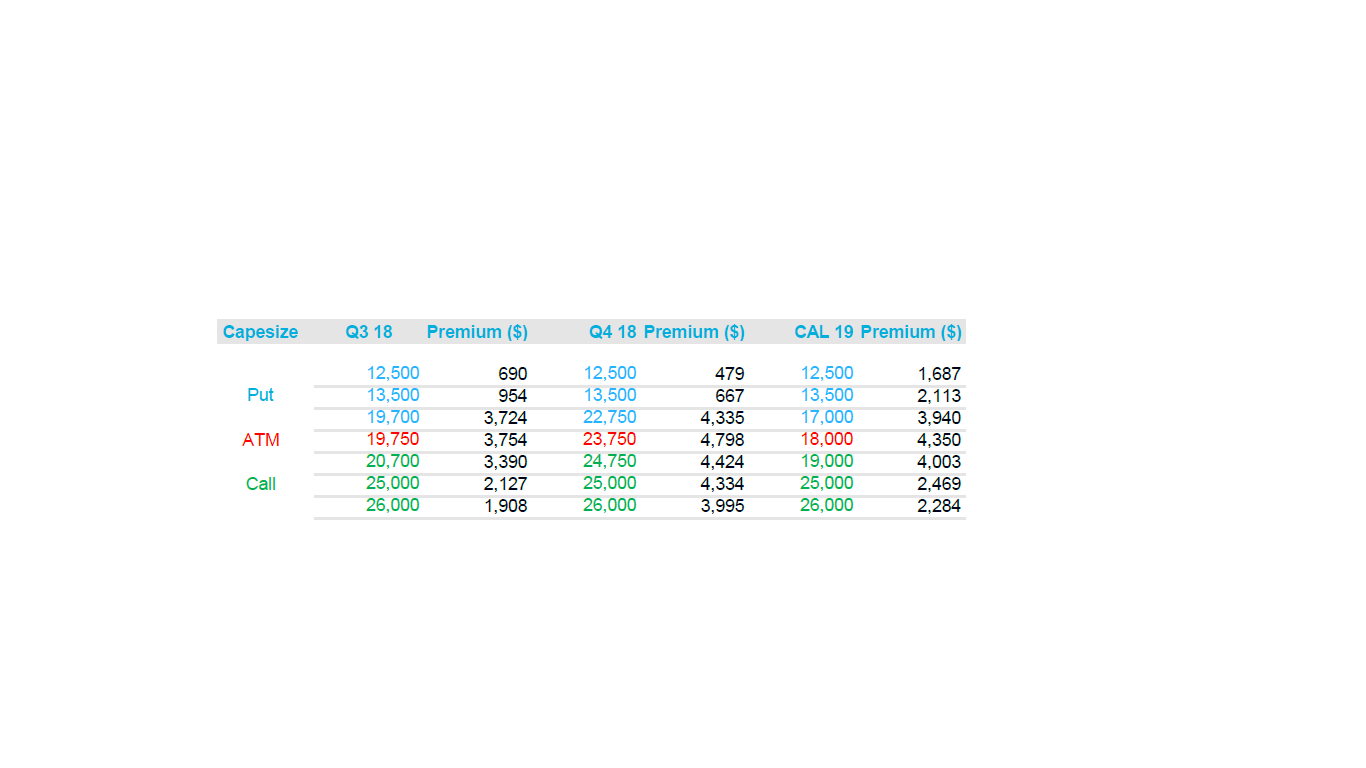
Source: Clarksons – 23/2/18
1. Show, with the help of a diagram, how a shipowner and a charterer can use options to hedge their freight income or cost for the last two quarters of 2018. Determine the cost of the option hedge in each case. Using the data from the realised spot Baltic assessments, determine the payoff of those option positions at the expiration of the contracts.
2. Construct a collar that guarantees the freight cost for the last two quarters of 2018 for a charterer to be between 26,000 and 13,500 $/day. Using the data from the realised spot Baltic assessments in 2018 determine the payoff of those option positions at the expiration of the contracts. With the benefit of hindsight, what would have been the best strategy that the company should have followed?
B) It is 12th June 2023, you are working for a liner shipping company and your 12,500 TEU ship takes 5000mt of 380cst bunker every month in Rotterdam. Currently you are about to negotiate the price to hedge your bunker exposure for the next 12 months (July 2023 to June 2024). The following forward curve for Rotterdam 380cst is shown on CME screen.
a) Assuming a flat interest rate term structure of 4% for each of the next 12 months, calculate the swap rate for a 12-month fixed for floating swap.
b) Briefly discuss what other risks are involved in using a series of forward or a swap contract to hedge your bunker exposure in this case.
Rotterdam Fuel Oil 380 cst (Platts) Futures Quotes on 12 June 2023
|
Maturity |
Forward Rate |
|
Maturity |
Forward Rate |
|
Jul-23 |
595.153 |
|
Apr-24 |
577.975 |
|
Aug-23 |
598.225 |
|
May-24 |
573.6 |
|
Sep-23 |
599.35 |
|
Jun-24 |
568.725 |
|
Oct-23 |
597.725 |
|
Jul-24 |
563.725 |
|
Nov-23 |
594.475 |
|
Aug-24 |
558.475 |
|
Dec-23 |
591.475 |
|
Sep-24 |
552.6 |
|
Jan-24 |
588.85 |
|
Oct-24 |
546.225 |
|
Feb-24 |
585.725 |
|
Nov-24 |
539.225 |
|
Mar-24 |
581.975 |
|
Dec-24 |
532.85 |
Question 4: Risk Analysis and Value at Risk
Given the Baltic Assessments for 2 quarters ahead FFAs for Average 5TCs of Capesize and 4TC of Panamax (5TC_C+2Q and 4TC_P+2Q) from 1 Jan 2018 to 7 June 2022 in Excel worksheet “BFA CSZ & PMX”,
a) Estimate the Rolling Volatility (annualised standard deviation) of the series using a 62-day window.
b) Estimate the Exponentially Weighted Average Volatility (RiskMetrics approach) for the series overthesameperiod as in part a),and plot thetwo volatilities,assuming!=0.94.
variance "x,t+1 = !"x,t +(1#!)rx,t
c) Estimate and plot the 1%-5day VaR for the two FFA prices from 8 June 2021 to 7 June 2022, using the Exponentially Weighted Average Volatility, and 250 days rolling volatility.
Question 5: Credit Risk Assessment
You are working for an investment bank’s shipping division in charge of credit assessment of clients. You are given two projects to look at and evaluate their credit risk.
1- The first project involves a 5-year loan for the purchase of a 7-year old MR tanker whose current market value is $28m.
2- The second project involves a 5-year loan for the purchase of a 10-year old Suezmax tanker whose current market value is $38m.
Both projects are set to operate on a one-ship-one-company basis and the companies would like to borrow as much as possible to the full price of the vessel. However, your bank has a strict policy of taking the vessel as collateral and only approving loans with a maximum default probability of 15%, in order to reduce its credit risk exposure. It is also known that both borrowers have good business and credit history; therefore, according to the assigned credit rating of borrowers, default may occur if value of the asset falls 5% below the amount borrowed.
a) Assuming that the volatility of the second price for 7-year old MR tanker is 25%, the volatility of the second price for 10-year old Suezmax tanker is 30%, the risk free rate is 4%, determine the maximum amount of funds that you are permitted to provide to each shipping company for the purchase of these vessels.
b) What would be the yield on each of these asset-backed loans and their risk neutral recovery rates?
c) What would be each loan amount, yield on the loan if it was sold in the market, and recovery rate for each project, if the bank increases the acceptable level of probability of default for this loan to 20%?
d) Discuss what other alternatives the bank has to reduce its credit risk exposure to this deal.
e) Optional: build a GBM model for the evolution of ship prices and find the probability of default at the end of year 3, using MC simulation.
https://apaxresearchers.com/storage/files/2023/06/21/9667-VUZ_17_20_19_srm-coursework-data-2023.xlsx
https://apaxresearchers.com/storage/files/2023/06/21/9667-ruZ_17_20_08_srm-coursework-irm-2023.pdf
Expert answer
This Question Hasn’t Been Answered Yet! Do You Want an Accurate, Detailed, and Original Model Answer for This Question?