Statistics> Questions and Answers > Regional vs. National Housing Price Comparison
Regional vs. National Housing Price Comparison
This document is a Regional vs. National Housing Price Comparison Report for MAT 240, analyzing housing prices and square footage differences between the East North Central region and national averages. The report investigates whether regional housing prices are lower than the national median and whether home sizes differ significantly from national standards. The study utilizes hypothesis testing, specifically one-tailed and two-tailed t-tests, to determine statistical significance. A sample of 500 randomly selected house listings from a dataset of 1,001 entries was analyzed. The one-tailed test examines whether the region’s home prices are lower than the national median, while the two-tailed test evaluates if the average square footage of homes significantly differs from national averages. Key findings indicate that the East North Central region’s home prices are significantly lower than the national median, with a p-value of zero, leading to rejection of the null hypothesis. Similarly, the square footage of homes in the region differs significantly from the national average, supported by statistical evidence. The report concludes that local market conditions, economic performance, and housing demand influence these variations. The findings provide valuable insights for real estate decision-making and regional market analysis. ... [Show More]Last updated: 1 year ago
Preview 1 out of 7 pages

Related documents
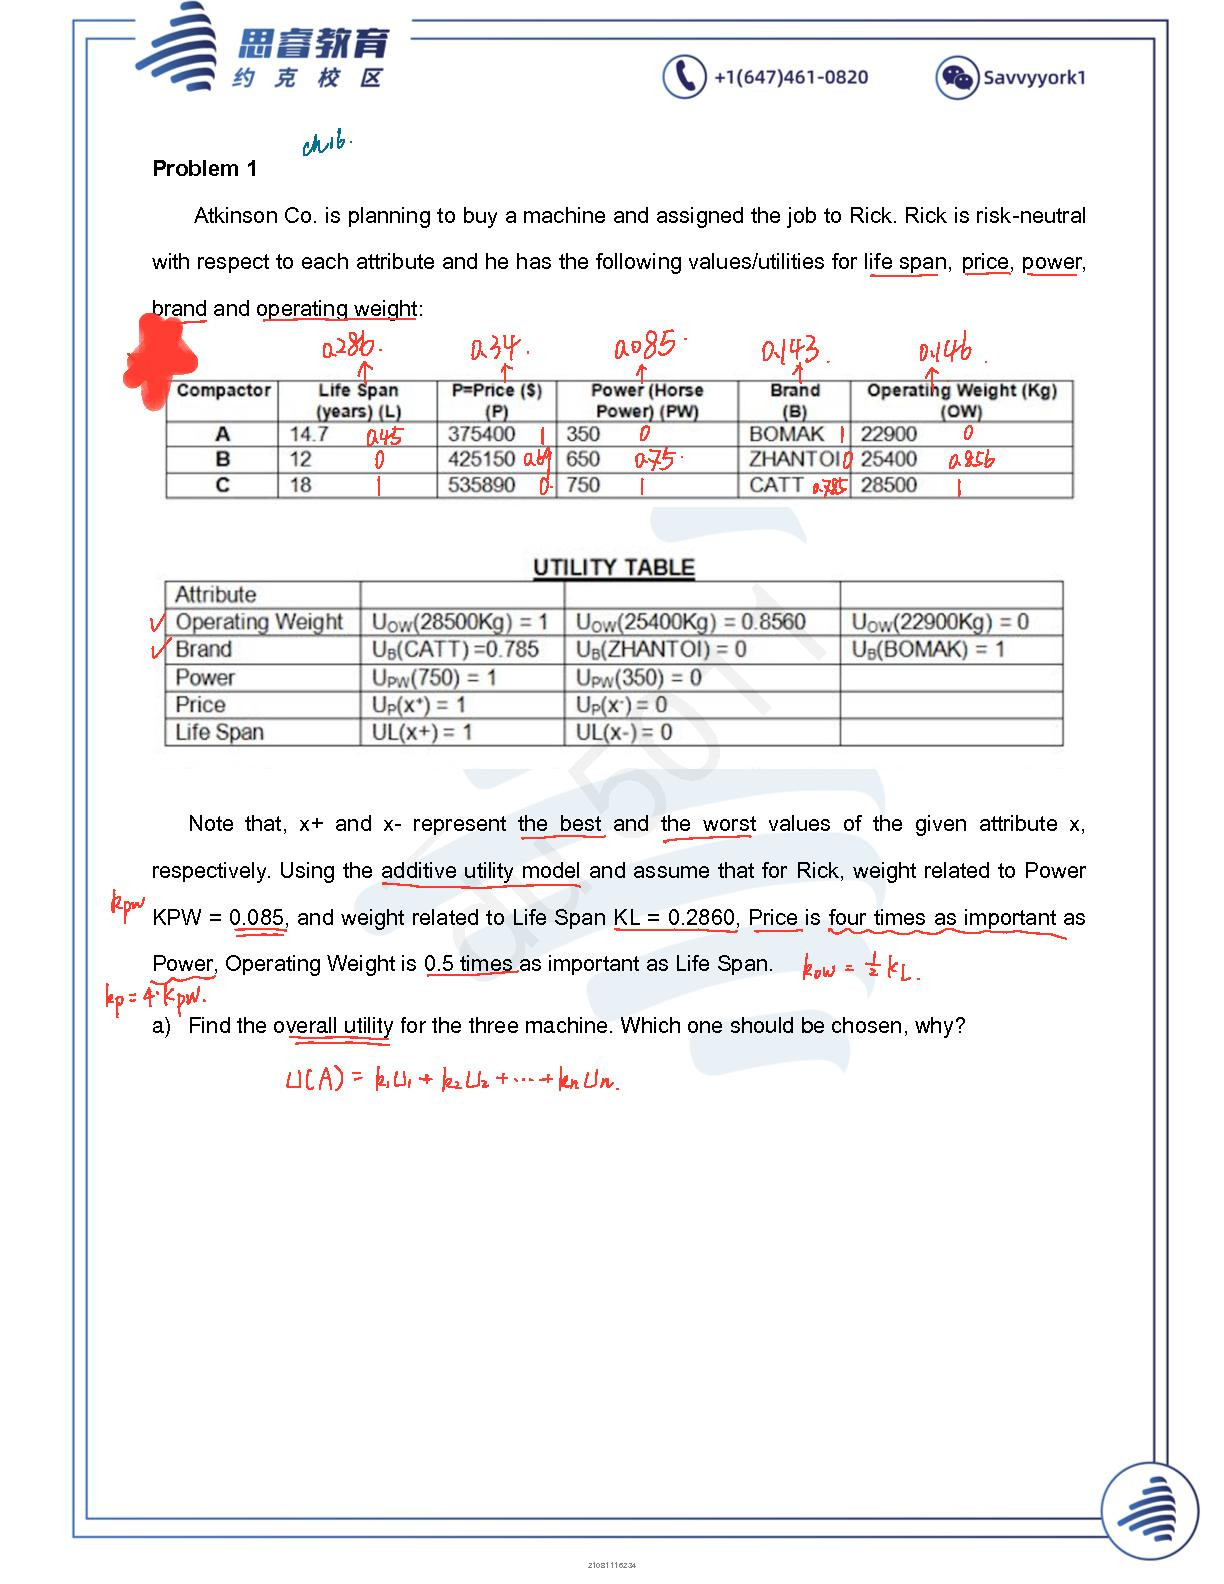
Atkinson Co. is planning to buy a machine and assigned the job to Rick - SOLVED
Atkinson Co. is planning to buy a machine and assigned the job to Rick. Rick is risk-neutral with respect to each attribute and he has the following values/utilities for life span, price, power, brand and operating weight
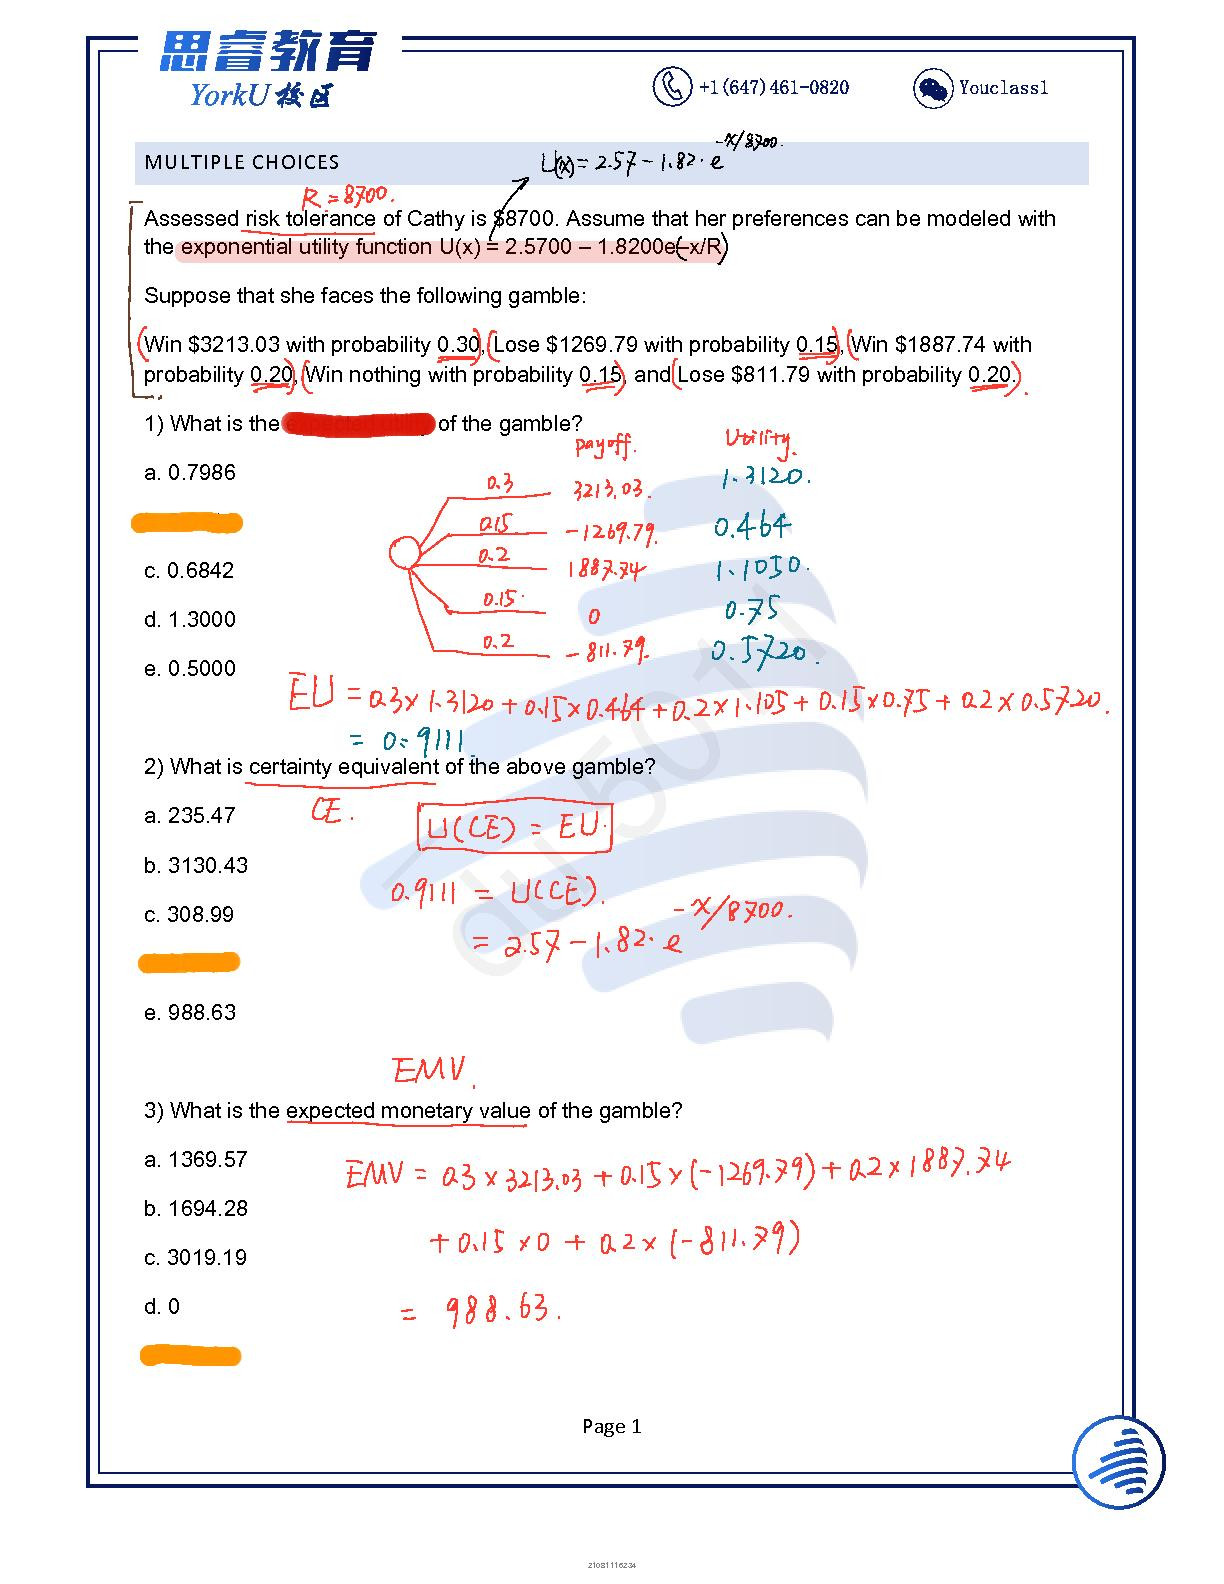
SOLVED: Assessed risk tolerance of Cathy is $8700. Assume that her preferences can be modeled with the exponential utility function U(x) = 2.5700 – 1.8200e–x/R
Assessed risk tolerance of Cathy is $8700. Assume that her preferences can be modeled with the exponential utility function U(x) = 2.5700 – 1.8200e–x/R Suppose that she faces the following gamble: Win $3213.03 with probability 0.30, Lose $1269.79 with probability 0.15, Win $1887.74 with probability 0.20, Win nothing with probability 0.15, and Lose $811.79 with probability 0.20. 1) What is the expected utility of the gamble? a. 0.7986 b. 0.9111 c. 0.6842 d. 1.3000 e. 0.5000

